
Home›NAAC AQAR report
NAAC AQAR figuresYour NAAC numbers, worked out from your own records.
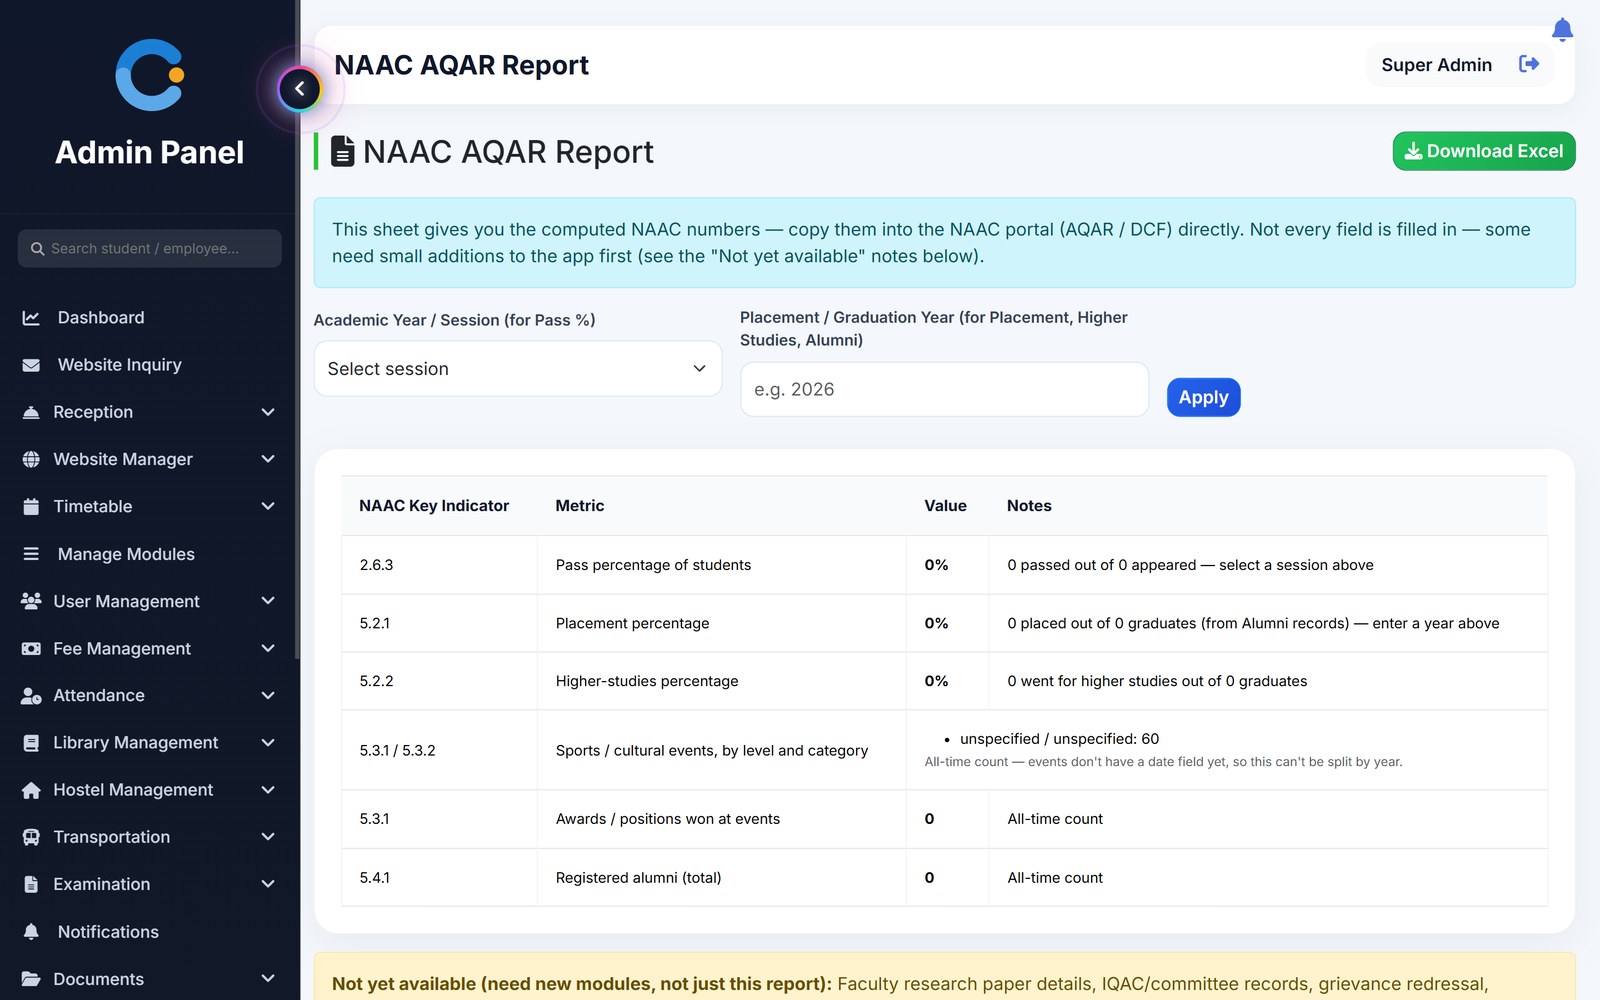
Pick a session and a graduation year, and CampusOS works out pass percentage, placement percentage, higher-studies percentage, events, awards and alumni from the data already in the system. Download the sheet as Excel and copy the figures into the NAAC portal. It covers these indicators only, not the full AQAR.
Why AQAR figures take weeks to collect
Pass percentage worked out by hand
The figure is calculated from the marks teachers already entered for the selected session, with passed and appeared students shown beside it.
Placement numbers chased from many people
Placed and higher-studies counts come from placement records, and the graduate count comes from alumni records for the year you choose.
Events never counted by level
Sports and cultural events are counted by level and category, and awards won at events are counted for you.
Alumni total nobody can confirm
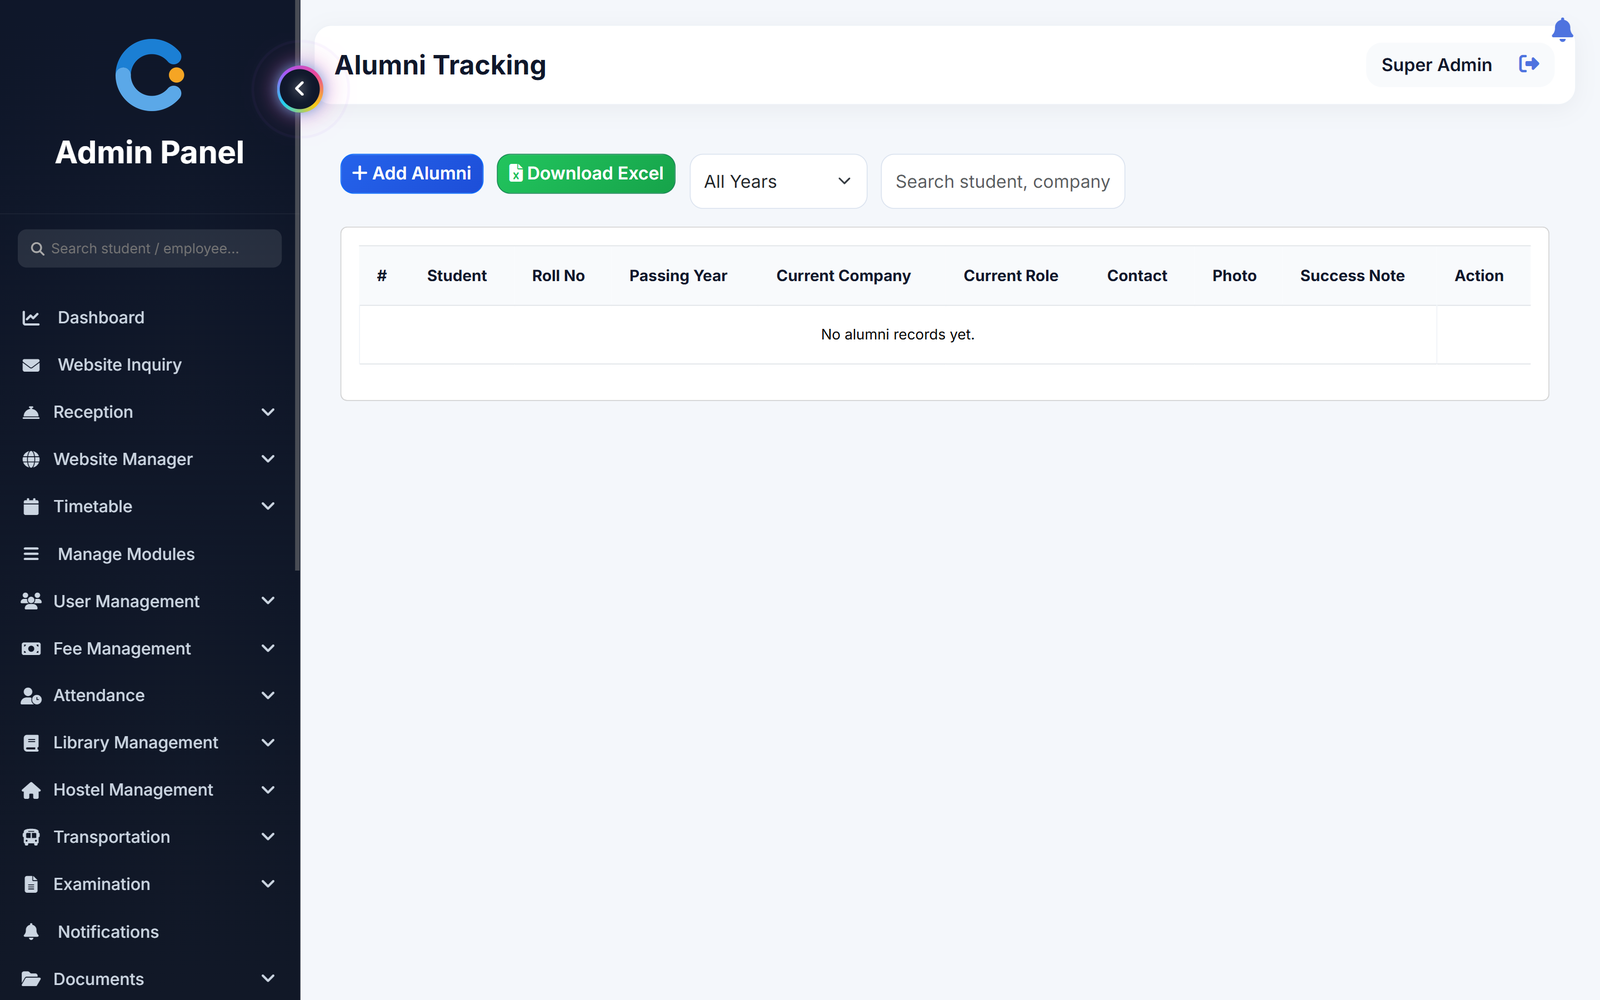
Registered alumni are kept as records with passing year, current company and role, so the total is one click away.
How the report is produced
Four steps, done by the admin.
- Keep the records updated. Exam marks, alumni, placements and events are entered as part of normal work in the system.
- Choose the session. Select the academic session. This sets the pass percentage.
- Enter the graduation year. Type a year such as 2026. This sets placement, higher-studies and alumni figures.
- Download and copy. Download the table as Excel and copy the figures into the NAAC portal.
What is included
Who sees what
Admin
Opens the report, chooses the session and year, and downloads the Excel sheet.
Teacher
Can open the same report with a teacher login.
Students and parents
The report is not available to student, parent or other staff logins.
Asked about naac aqar report
Does CampusOS generate the full AQAR?
No. It works out six indicators: pass percentage, placement, higher studies, events, awards and alumni. Faculty research papers, IQAC and committee records, grievance redressal and institutional best practices are not available yet.
Can it submit data to the NAAC portal?
No. You download the figures as Excel and copy them into the NAAC portal yourself.
Which figures are for a selected year?
Pass percentage follows the session you select. Placement, higher-studies and graduate counts follow the year you type. Events, awards and total alumni are all-time counts, because events do not have a date yet.
How is pass percentage worked out?
From the marks entered for the selected session. A student is counted as not passed in an exam if any subject is below its passing marks. Absent entries are left out.
Can we download the report?
Yes. The table can be downloaded as an Excel file.
Modules that share the same records
Exams & results
Exam schedules, marks entry by the subject teacher, grades, results and printable report cards.
Attendance
Period-wise attendance by the teacher, locked after saving, with class and student reports.
Admissions & enquiries
Website enquiries, follow-up log, front-office reception and visitor records.
See naac aqar report running with your institution's name on it.
- A real walkthrough, not a slide deck. We set your institution up while you watch.
- Bring your hardest question. Fees and exam patterns are where most systems fall over.
- No obligation. If it is not right for you, we will say so.
Book a free demo
Tell us about your institution and we will show you exactly how it would run.